Table of Contents
Record desktop videos using VLC media player
https://www.vlchelp.com/how-to-record-desktop/
To record mouse, add the following options instead
:screen-follow-mouse :screen-mouse-image=file:///C:/Users/Pictures/Mouse.png
Integrate Mathjax with Gitlab
A quick (not the best way, though) way to integrate Mathjax with Gitlab. Tested on Gitlab 7.9.4 and Gitlab shell 2.6.0.
Create the file /home/git/gitlab/app/views/layouts/_mathjax.html.haml, e.g.,
sudo -u git nano /home/git/gitlab/app/views/layouts/_mathjax.html.haml
with the following content
:javascript
  (function() {
    var ga = document.createElement('script');
    ga.type = 'text/javascript';
    ga.async = true;
    ga.src = ('https://cdn.mathjax.org/mathjax/latest/MathJax.js?config=TeX-AMS-MML_HTMLorMML');
    var s = document.getElementsByTagName('script')[0]; s.parentNode.insertBefore(ga, s);
  })();
Then edit the file _head.html.haml
sudo -u git nano /home/git/gitlab/app/views/layouts/_head.html.haml
and change to the following (the first line already existed and the second line was newly added:
= render 'layouts/piwik' if extra_config.has_key?('piwik_url') && extra_config.has_key?('piwik_site_id')
= render 'layouts/mathjax'
Note one can control the use of mathjax just like the use of piwik.
Then restart gitlab using
sudo service gitlab restart
Install GitLab on existing Apache2 web server
First, setup a domain to point to the server such as gitlab.example.com.
Second, follow the procedure at https://gitlab.com/gitlab-org/gitlab-ce/blob/master/doc/install/installation.md till the end of Step 6. Do not proceed with 7 to install Nginx.
If you are using MySQL, remember to setup mysql database.
Third, configure apache2
- Enable proxy_http
sudo a2enmod proxy_http
- Create gitlab.conf with the following
<VirtualHost *:80> ServerName gitlab.example.com #git lab passthrough ProxyPass / http://localhost:8080/ ProxyPassReverse / http://localhost:8080/ </VirtualHost> - Start apache2
sudo a2ensite gitlab.conf
sudo service apache2 reload
- Configure sending emails through smtp. Add the following to /home/git/gitlab/config/environments
config.action_mailer.delivery_method = :smtp
config.action_mailer.perform_deliveries = true
config.action_mailer.raise_delivery_errors = true

config.action_mailer.smtp_settings = {
  :address              => "smtp.gmail.com",
  :port                 => 587,
  :domain               => 'gmail.com',
  :user_name            => 'account@gmail.com',
  :password             => 'password',
  :authentication       =>  :plain,
  :enable_starttls_auto => true
}
R read data from clipboard for Windows and Mac
On Mac
On Mac Os X, the function pipe can be used to read and copy to clipboard. I often copy data from excel to clipboard and then read them into R. Specifically, the following code can be used.
dset <- read.table(pipe("pbpaste"), sep="\t")
On Windows
On Windows OS, the following can be used
x <- read.table(file = "clipboard", sep = "\t")
R plot highlight an area under a density curve
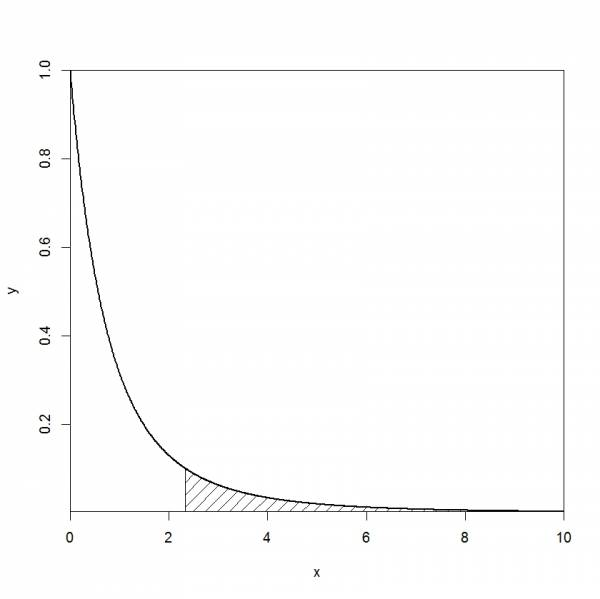
When illustrating p-value for a given distribution, one might want to highlight / mark / shade a specific area. This can be done using the function polygon. Below is an example for an F distribution.
x<-seq(0, 10, 0.01)

y<-df(x, 2, 6)

plot(x,y,type='l', lwd=2,yaxs = "i", xaxs="i")

polygon(c(2.33,seq(2.33,10,.01),10),c(0,df(seq(2.33,10,.01),2,6),0), density = c(10, 20), angle = c(45, -45))
<< Newer entries | Older entries >>
Note. Everything on this blog only reflects my personal view which may or may not be true and is not related to any organization or institute.

