blog:barplot_with_error_bars_annotated_by_kruskal-wallis_or_anova_p-value
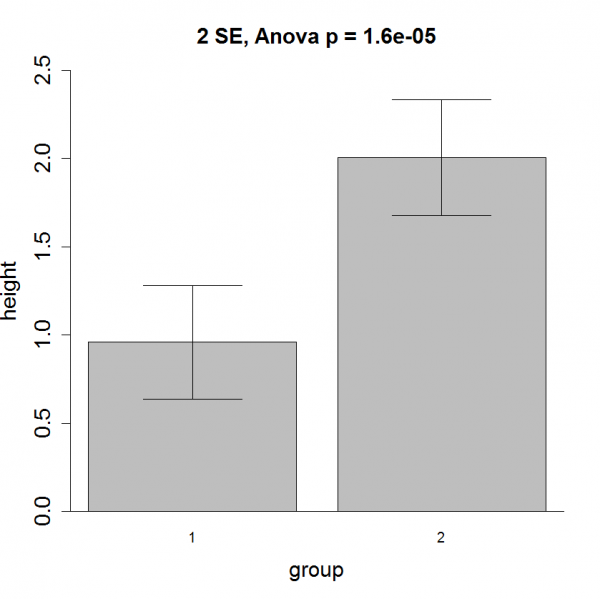
Barplot with error bars, annotated by Kruskal-Wallis or ANOVA p-value
Use the WGCNA package.
To install, use the command
install.packages('WGCNA')
This package requires the installation of the impute package that can be installed using
source("http://bioconductor.org/biocLite.R")
biocLite("impute")
An example:
The code used
verboseBarplot(height,group,numberStandardErrors=2,AnovaTest=TRUE, main="2 SE, Anova", ylim=c(0, 2.5))
You could leave a comment if you were logged in.
blog/barplot_with_error_bars_annotated_by_kruskal-wallis_or_anova_p-value.txt · Last modified: 2016/01/24 09:48 by 127.0.0.1

