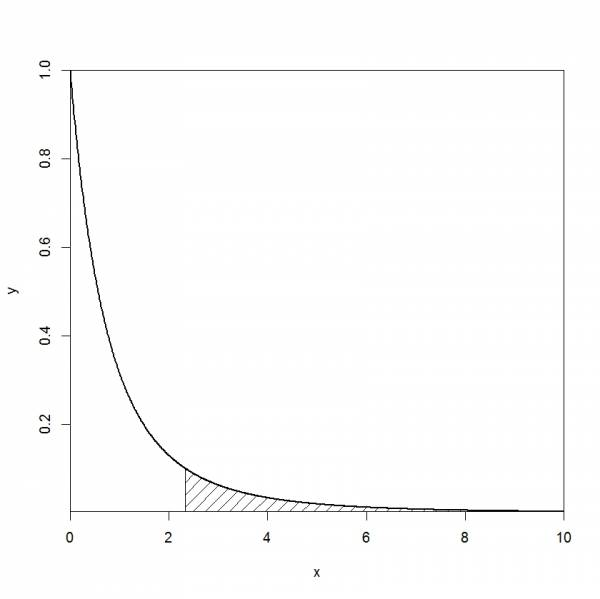
R plot highlight an area under a density curve
When illustrating p-value for a given distribution, one might want to highlight / mark / shade a specific area. This can be done using the function polygon. Below is an example for an F distribution.
x<-seq(0, 10, 0.01)

y<-df(x, 2, 6)

plot(x,y,type='l', lwd=2,yaxs = "i", xaxs="i")

polygon(c(2.33,seq(2.33,10,.01),10),c(0,df(seq(2.33,10,.01),2,6),0), density = c(10, 20), angle = c(45, -45))
